1/6



Azura Edo IPP
1K+Tải về
13.5MBKích thước
12.1(08-11-2020)
Chi tiếtĐánh giáthông tin
1/6

Mô tả của Azura Edo IPP
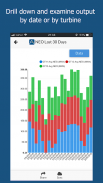
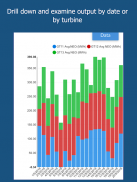
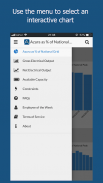
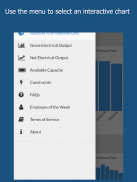
This app shows the daily output of the 461MW Azura-Edo IPP. Users can interact with the data by examining trends over time or by drilling down to a particular time period. By clicking on the legends next to each graph, users can also narrow their focus to a particular turbine. In addition, for each graph, there is a data button. Pressing this button allows you to then select a particular date and pull up the full set of statistics for that day.
Azura Edo IPP - Phiên bản 12.1
(08-11-2020)Có gì mớiThis is the first public-release version of the Azura-Edo IPP app.
Azura Edo IPP - Thông tin APK
Phiên bản APK: 12.1Gói: com.appsheet.whitelabel.guid_b675887e_e844_4960_aa51_d0066053dc87Tên: Azura Edo IPPKích thước: 13.5 MBTải về: 0Phiên bản: : 12.1Ngày phát hành: 2020-11-08 06:23:57Màn hình tối thiểu: SMALLCPU được hỗ trợ: x86, x86-64, armeabi, armeabi-v7a, arm64-v8a
ID gói: com.appsheet.whitelabel.guid_b675887e_e844_4960_aa51_d0066053dc87Chữ ký SHA1: 3D:B9:08:24:92:60:AE:77:8B:D9:1E:02:79:85:FF:1F:3D:C0:5E:CBLập trình viên (CN): AndroidTổ chức (O): Google Inc.Địa phương (L): Mountain ViewQuốc gia (C): USBang / Thành phố (ST): CaliforniaID gói: com.appsheet.whitelabel.guid_b675887e_e844_4960_aa51_d0066053dc87Chữ ký SHA1: 3D:B9:08:24:92:60:AE:77:8B:D9:1E:02:79:85:FF:1F:3D:C0:5E:CBLập trình viên (CN): AndroidTổ chức (O): Google Inc.Địa phương (L): Mountain ViewQuốc gia (C): USBang / Thành phố (ST): California


